2019 Estate Sale Industry Survey Results
We are excited to share with you the results of our 2019 Industry Survey. The 2019 Industry Survey is part of our ongoing effort to gain a better understanding of the estate sale industry, how it runs, and how trends shift over time.
We provide the results of these surveys to our customers so they can see where their company stands on the national level, and where the industry is headed. Take a look at the results of the 2018 Industry Survey to see last year’s results. The industry has stayed relatively consistent between years.
A summary of the 2019 results is provided below. If you want more detail, take a look at the full data report.
What type of sales do you conduct?

There has not been much of a change over the years in the type of sales our respondent’s conduct. Companies that only conduct estate sales made up 84% of the survey. 14% were hybrid companies that conduct both estate sales and auctions while auction only companies made up 2% of survey respondents.
What is your gender?

The estate sale industry is a female-led industry. 66% of survey respondents are women, while 32% are male. 2% preferred not to say. We are seeing a 3% increase in women respondents from the 2018 survey, where 63% responded women.
What is your age at the time of taking this survey?

A new year and a year older. In 2018 the average age of respondents was 58.4 years old. This year we have gone up to 59 years for the average age.
What is the highest level of education you have completed?

92.47% of companies have some college education or above, with 35.43% having some college, 34.92% completing their undergrad, and 13.57% completed graduate school
Is your estate sale business your primary source of income?

From 2017 to 2018, we saw a decrease in companies that have an estate sale as their primary source of income. However, in 2019 we saw that number go up from 2018's 44.10% to 49.5%.
In which state are most of your sales located?

Estate sale companies are located all over the United States, but we do see some areas that are more active than others. Once again, Texas and California were our two biggest states for survey respondents.
How many years has your company been conducting sales?

The average company age of survey respondents is 15 years. This number has stayed constant over the past three years of surveys.
On average, how many sales do you conduct a year?

On average, estate sale companies conduct 31 sales per year. This number can vary significantly based on company size, market, and business model the company uses.
Does your company currently have a business license?

State and local laws can greatly affect if a business is required to have a business license. Of our survey respondents, 75% said that they have a business license, while 25% did not.
How much staff (including yourself) do you typically have on hand during each sale?

On average, companies have five staff members at their sale. This has stayed constant across the yearly surveys.
What is the average hourly wage paid to your staff/workers?

We did not see much of a change for the hourly wage paid to staff between 2018 and 2019. The average hourly wage paid was $12.
How do you report the majority of your workers’ income?

Over half of survey respondents (51.43%) said they report their worker’s income as contract workers through a 1099. While 28.83% do not use staff, and 19.74% report worker’s pay through a W-2. We saw a decrease in 1099 reporting of 3.32 % and an increase in W2 reporting of 4.95% in 2019 from 2018.
Do you currently have workers compensation insurance?

20% of survey respondents carry workers’ Compensation Insurance, where 63% do not. This is a slight increase over the 2018 survey.
Do you conduct background checks on your employees?

22% of companies perform background checks on their employees, while 58% do not.
Does your company currently have liability insurance?

We did not see much of a change between 2019 and 2018 when it comes to companies having liability insurance. 73% have some form of liability insurance, while 27% do not.
Is your company currently bonded?

Between all of the surveys, the number of companies that are bonded has seen a decrease. This year the number of companies that are bonded dropped 2.37%. We should note that this very much could be within the margin of error. 64% of companies are not currently bonded, while 36% are.
Do you use a Point of Sale system? If so, which one?

47.18 percent of companies noted that they used Square as their point of sale system. This is a slight increase over last year’s 45.39%
Does your company take items on consignment?

45% of companies take items on consignment, while 55% do not. These numbers varied slightly from 2018, but we think it has stayed relatively constant. The difference is within the margin of error.
Do you own a consignment shop?

In 2019 8.6% of companies had a consignment shop, while 91.4% did not.
Do you offer estate sale buyouts as a service?

We saw little change in Buyout Services being offered between 2018 and 2019. 72.3% of companies do not provide buyouts as a service, while 27.7% do.
Are you a certified appraiser?

57% of companies utilize a certified appraiser. 20% are certified appraisers themselves while 7% are not certified appraisers themselves, but have one on staff. 30% hire an outside appraiser when needed.
What source(s) do you use to price your items?

For online resources, eBay was the most popular used to help price items with 87.99% of respondents. Live Auctioneers was second with 39.03% of respondents and Worthpoint third with 37.64% of respondents. 79.91% of survey respondents use their experience when pricing items.
Do you require a signed contract for each sale?

96% of companies require a signed contract when conducting a sale, while 4% do not. This has stayed relatively constant year over year.
What is your average commission rate?
.png)
Average commission rate went up two percentage points from 2018's 35% to 2019's 37%. This change is within the margin of error, but we are going to keep paying attention to this trend in future surveys.
Do you charge your client any fees outside of commission?

55% of companies charge fees outside of their base commission rate. 45% of companies do not.
What types of additional fees outside of commission do you charge? (Check all that apply.)

Trash Removal/dumpster was the most common fee charged by estate sale companies, with 75% of survey respondents. Advertising was second with 46% of respondents, and Professional Cleaning was third with 29%.
How soon after a client's contract has been signed do you typically start their sale?

After signing a contract, on average, it takes 16 days for a company to start a sale. This is the same as what was found in the 2018 survey.
On average, how many days does it take your company to set up an estate sale?

The average time it takes a company to set up a sale is nine days.
Do you share your sales on social media?

Facebook is the leader in this category amongst estate sale companies. 91.15% of companies use Facebook to advertise. Instagram came in second with 33.42% of companies. We saw the most significant increases in social media coming with Facebook and Instagram over 2018. Twitter saw a slight decrease from 18.11% in 2018 to 16.71% in 2019. We should note that this decrease is within the margin of error.
Does your company have an email subscriber list?

In 2019 we saw a slight increase in subscriber email lists being used by companies. 77.4% of companies use an email list while, 22.6% do not.
Which paid, online marketing channels did you use over the past 12 months to advertise your company?
(Select all that apply.)

Social media is not the only online digital platform estate sale companies use to advertise their sales. EstateSales.NET is used by 86.95% of respondents, while Facebook Ads are used by 43.10% of survey respondents. EstateSales.org is used by 20.94% of respondents, and Estate Sale.com is used by 15.27% of respondents. Google Ads is used by 18.72% of survey respondents.
Does your company currently have a website?

There has been a slight increase in survey respondents that have a company website over 2018. 73.5% of companies have a website, while 26.5% do not.
What is the most common reason your clients need an estate sale?

47.84% of survey respondents said that death was the most common reason their clients needed an estate sale while 47.15% said it was because of Downsizing/moving.
What is the smallest sale your company would be willing to take (in gross revenue of sale)?

In 2017 the minimum amount required for an estate sale company to take a sale was $5659.74. In 2018 that number jumped up to $8,228. In 2019 that number stayed nearly constant at $8317.
Did you turn down any sales within the past 12 months?

In 2019 92% of companies said that they had turned down a sale over the past 12 months. In 2018 this number was slightly lower at 88.17%. 8% of companies did not turn down any sales over the past 12 months.
What was your reason(s) for turning down sales in the past 12 months?
.png)
In 2019 the most common reason a company turned down a sale was that it had too few items (81%). The second most common reason was that the sale had items of little value (71%). This is very similar to what was found in the 2018 survey.
On average, what are your total gross sales for an individual estate sale?

In 2019 the average gross sales from an estate sale were $19,000. In 2018 it was $18,565.
After the contract is signed, do you allow the client or the client's family members to remove
items from the home?

68.88% of companies allow clients to remove items from a sale after the contract has been signed, but whether they take a commission or not on the removed items is a different story. 8.29% of companies allow items to be removed without a commission being taken. 19.35% of companies allow items to be taken out, but will always charge their commission, while 41.24% charge their commission only sometimes. 31.11% of companies do not allow items to be removed from the sale after the contract is signed.
What do you do with found cash?

22% of companies take a commission on found cash. This is a 4% increase from 2018, while 78% of companies return the cash without taking a commission.
Do you pre-sell items?

33% of companies will pre-sale items, while 67% do not. There was a 5.1% increase from 2018 on the number of companies that allow pre-sales.
Do you allow early entry into sales?
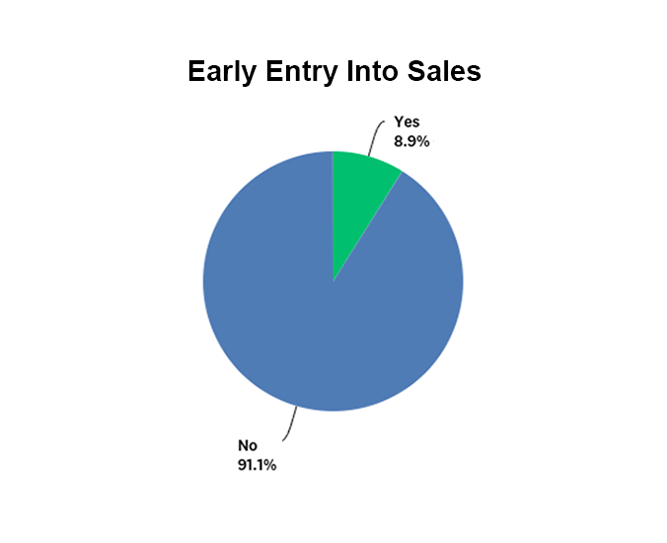
91.1% of companies do not allow early entry into sales, while 8.9% do. These numbers have not changed much over the years of doing the industry surveys.
What procedure do you use to let buyers into your sales?

58.41% of companies use a line formation system to direct people into the sale, while 32.21% provide numbers to shoppers, and 29.57% use a sign-up sheet.
Do you allow your clients to attend their own estate sales?

41% of companies do not allow clients to attend their own estate sales. 50% allow it, but discourage clients from attending, while 8% allow and encourage it.
Do you accept credit cards?

84% of companies accept credit cards. This is an increase of almost 5% over 2018. 26% of companies will accept a credit card but require a minimum purchase amount. 38% accept credit cards and do not require a minimum purchase amount. 20% of companies charge a fee when a credit card is used. 16% do not accept credit cards at their sales.
Do you collect sales tax at your sales?

Sales tax laws vary from state to state, so not every company is required to collect sales tax. 51% of companies do not accept sales tax, while 49% do accept sales tax.
What do you do with unsold items when the sale is over?

After a sale, if there are unsold items, a company must decide what to do with them. 73.32% of companies donate unsold items. 59.16% of companies leave the unsold items with the client; 41.30% of companies dispose of the items.
Do you move unsold items from one estate to another?

15% of companies move unsold items to other estate sales, while 85% of companies do not.
On average, how many days after a sale has ended do you typically pay your client?

This number did not change much from 2018. On average, companies deliver payment to their client in seven days after the sale has ended.
Would you like to see your state regulate the estate sale industry (license requirements, education
requirements, etc.)?

42% of companies feel that the industry should be regulated, while 58% do not. These numbers have not changed much over the past three surveys. Any change is within the margin of error.